OOMKilled or OutOfMemoryError: where a JVM's memory goes in a pod
The scenario is a classic. A Spring Boot service runs in a pod limited to
1 Gi, with -XX:MaxRAMPercentage=75, as recommended in
the article on day-to-day Kubernetes.
Metrics show a heap that tops out at 500 MB. And yet, twice a day, the pod
restarts. kubectl describe pod shows OOMKilled, exit code 137. No
OutOfMemoryError in the logs, no heap dump.
It isn't a contradiction: the JVM and Kubernetes don't measure the same memory. This article explains the difference between the two errors, where the memory that isn't in the heap goes, how to measure it, and how to turn that into consistent requests and limits.
Two errors, two mechanisms#
OutOfMemoryError | OOMKilled | |
|---|---|---|
| Who triggers it | The JVM | The Linux kernel (the container's cgroup) |
| What is full | The heap (or metaspace, or direct memory) | The process's total memory exceeded the container limit |
| What you get | An exception, a stack trace, a heap dump if configured | A process killed outright, exit code 137 (128 + SIGKILL) |
| Where to look | Application logs | kubectl describe pod, Last State field |
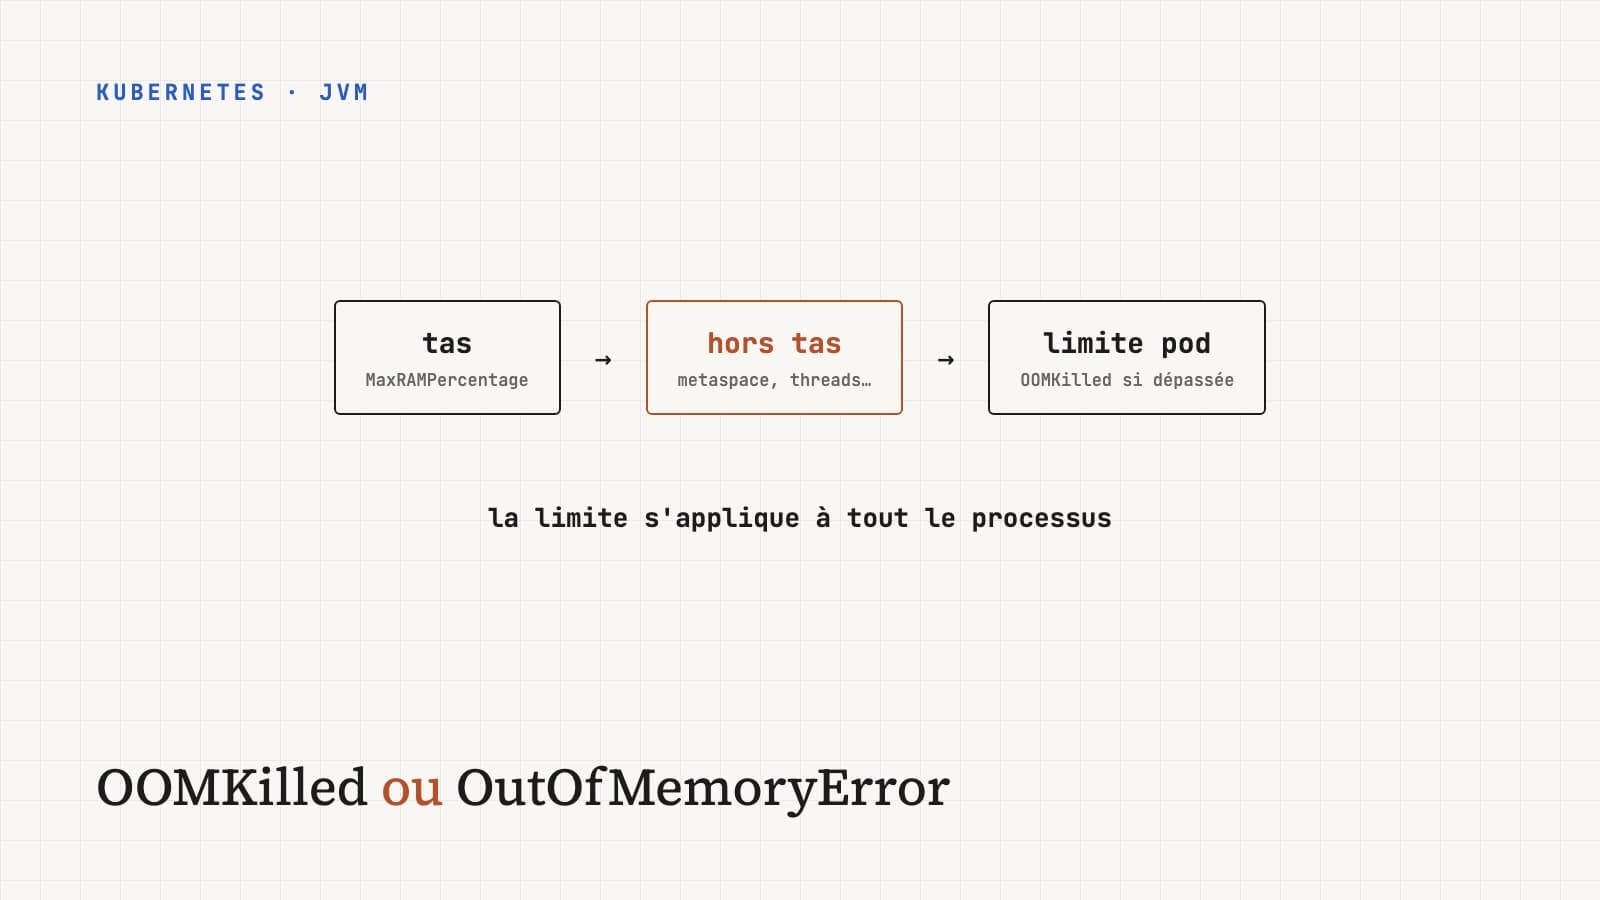
The key difference is in the second row. -Xmx or MaxRAMPercentage cap
the heap. The Kubernetes limit applies to the whole process.
Everything the JVM uses on top of the heap counts for Kubernetes and not for
the JVM.
Practical consequence: -XX:+HeapDumpOnOutOfMemoryError is useless against
an OOMKilled. The kernel kills the process without warning, it has no time
to write anything.
What the JVM uses outside the heap#
┌─────────────────── container limit: 1 Gi ────────────────────┐
│ Heap                           │ Off-heap                     │
│ MaxRAMPercentage=75 → 768 Mi   │ metaspace, code cache,       │
│                                │ thread stacks, GC,           │
│                                │ direct buffers, native libs  │
└────────────────────────────────┴──────────────────────────────┘
                                   ▲
                    256 Mi left for all of that
The main items, with orders of magnitude for a typical Spring Boot service:
- Metaspace: metadata of loaded classes. A Spring Boot service with Hibernate and a few starters easily loads 20,000 classes, or 100 to 200 MB. Uncapped by default.
- Code cache: code compiled by the JIT. Up to 240 MB reserved, often 50 to 100 MB actually used.
- Thread stacks: about 1 MB reserved per thread by default (
-Xss). 200 Tomcat threads plus connection pools, Kafka threads and GC threads, and you quickly go past 200 MB reserved, even if only part of it is actually used. - GC structures: G1 uses memory for its own bookkeeping, on the order of a few percent of the heap.
- Direct buffers: Netty, reactive HTTP clients and some drivers allocate
off-heap (
ByteBuffer.allocateDirect). By default, the limit equals the maximum heap size. - Native libraries and the allocator: compression, TLS, and fragmentation in the libc memory allocator, which alone can account for tens of megabytes in a heavily multithreaded process.
Added up, the off-heap footprint of an ordinary Spring Boot service is often between 250 and 400 MB. With a 1 Gi limit and 75% for the heap, 256 MB remain: exactly the zone where the pod survives most of the time, then dies when metaspace, threads and buffers grow at the same time under load.
Measure instead of guessing#
The JVM can break down its own usage, as long as you ask at startup:
-XX:NativeMemoryTracking=summary
Then, on the running pod:
kubectl exec -it api-7d9f-xk2p -- jcmd 1 VM.native_memory summaryTotal: reserved=2143MB, committed=931MB
- Java Heap (reserved=768MB, committed=512MB)
- Class (reserved=1105MB, committed=182MB)
- Thread (reserved=231MB, committed=231MB)
- Code (reserved=247MB, committed=74MB)
- GC (reserved=96MB, committed=71MB)
- Internal (reserved=5MB, committed=5MB)
- Other (reserved=34MB, committed=34MB)
The column that matters is committed: the memory actually requested from the system. Here, 931 MB for a container limited to 1 Gi, with a heap at only 512 MB. The problem jumps out: 230 MB of threads and 180 MB of classes.
Two caveats. NMT doesn't see everything: allocations made by native
libraries outside the JVM and allocator fragmentation don't show up. The
Kubernetes metric container_memory_working_set_bytes, the one the kernel
compares to the limit, will therefore be a bit higher. And NMT has a small
cost: I turn it on to diagnose, not permanently.
Fixing it: shrink off-heap or leave more room#
Once you've measured, the levers are well known.
Leave more room for off-heap. 75% suits containers of 2 Gi and above. For 512 Mi or 1 Gi, 60 to 65% is often more realistic, or a fixed heap size computed from the NMT measurement.
Cap what can be capped, so growth produces an explicit JVM error rather
than a silent OOMKilled:
-XX:MaxRAMPercentage=65
-XX:MaxMetaspaceSize=256m
-XX:ReservedCodeCacheSize=128m
-XX:MaxDirectMemorySize=128m
-Xss512k
Lowering -Xss isn't risk-free: deeply recursive code can trigger
StackOverflowError. 512 KB is enough for most web services, but check it
with load tests.
Reduce the thread count. A 200-thread Tomcat pool in a pod limited to
one CPU makes no sense. Bringing it down to 50, or switching to virtual
threads (Java 21, spring.threads.virtual.enabled=true), whose stacks live
in the heap and grow on demand, directly shrinks the "Thread" line.
Requests and limits: what each value changes#
Kubernetes uses two values per resource, and they don't play the same role.
- The request is for placement: the scheduler only puts the pod on a node that has that amount available. It limits nothing at runtime.
- The limit is a ceiling. For memory, exceeding it means
OOMKilled. For CPU, exceeding it means being slowed down (throttling).
For a JVM's memory, I set request = limit. A JVM almost never gives heap memory back to the system once it has taken it. If the request is lower than the limit, the pod can land on a node that can't really absorb its actual usage, and it will be among the first killed when the node runs short of memory.
For CPU, the question is more debated. Two effects are worth knowing:
- the JVM sizes GC, JIT and common
ForkJoinPoolthreads from the number of CPUs it sees, derived from the CPU limit (and not the request, since Java 19); - with fewer than 2 visible CPUs, or less than 1,792 MB of memory, the JVM defaults to the Serial GC, poorly suited to a web service. A 1 Gi pod is therefore affected, whatever its CPU count.
A container with a 500m CPU limit therefore sees a single processor, runs
the Serial GC, and gets throttled on the slightest spike, for instance during
Spring startup, which compiles a lot of code. Two reasonable options: no CPU
limit, relying on the request (the pod uses the node's spare CPU), or a limit
of at least 2 CPUs. Either way, you can force the value the JVM sees with
-XX:ActiveProcessorCount=2 and the GC with -XX:+UseG1GC.
resources:
  requests:
    memory: "1Gi"
    cpu: "500m"
  limits:
    memory: "1Gi"
    # no CPU limit: the pod can exceed its request when the node has spare CPU
env:
  - name: JAVA_TOOL_OPTIONS
    value: >-
      -XX:MaxRAMPercentage=65
      -XX:MaxMetaspaceSize=256m
      -XX:ActiveProcessorCount=2
      -XX:+UseG1GC
      -XX:+ExitOnOutOfMemoryError
-XX:+ExitOnOutOfMemoryError completes the setup: a JVM that hit an
OutOfMemoryError is often in an inconsistent state. Letting it exit cleanly
lets Kubernetes restart it, instead of leaving it serving errors for hours.
The approach in short#
- Identify the error:
OOMKilled(code 137 inkubectl describe pod) orOutOfMemoryError(in the logs). They don't have the same causes. - For an
OutOfMemoryError: heap dump and heap analysis, as described in the heap dump article. - For an
OOMKilled: enable NMT, measure off-heap under real load, compare with the limit. - Adjust: a lower heap percentage, caps on metaspace, code cache and direct memory, fewer threads.
- Set request = limit for memory, and handle CPU with what the JVM derives from it in mind.
The "let's raise the limit to 2 Gi" reflex often fixes the symptom, but without measuring, you don't know whether you gave room to the heap, which had plenty, or to off-heap, which was short. And you pay for twice the memory per replica to fix a 200 MB problem.